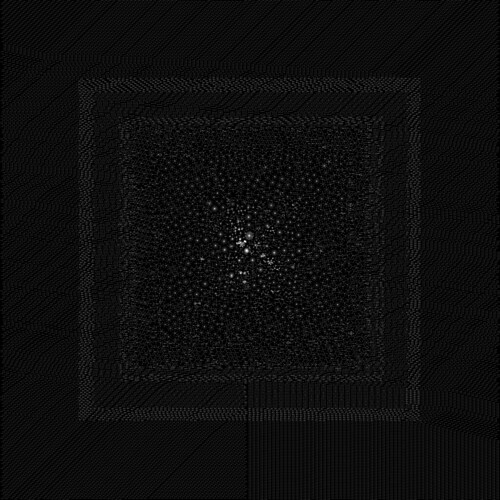
Last time we got as far as sourcing bulk data from the Twitter Streaming API and producing (over the course of several hours compute-time) a beautiful set of constellations like this:
upon which we wondered:
- how can we make the rendering faster?
- how can we get rid of the fairly dull stuff around the edge?
- how can we get a more detailed view of the center?
It turns out that there's one part of Graphviz which addresses all of these questions: ccomps.
Graphs like this are made up of a finite number of connected components. You can think of these as the distinct separable mention islands which make up the diagram. What if there were a way to plot only the n largest of the connected components? What if there were a way to plot the single largest connected component? Turns out that there is.
Graphviz, as well as having tools like dot and sfdp and neato for plotting graphs, also includes a tool called ccomps which can separate out the connected components of a graph.
Let's start by picking out the blob at the center of our big graph. Zooming in, it looks like this:
so let's take our file mention-graph.gv and pass it through ccomps before rendering it:
ccomps -zX#0 mention-graph.gv | sfdp -Gbgcolor=black -Ncolor=white -Ecolor=white -Nwidth=0.02 -Nheight=0.02 -Nfixedsize=true -Nlabel='' -Earrowsize=0.4 -Gsize=1.5 -Gratio=fill -Tpng > ccomp0.large.pngHere we used ccomps -zX#0 to pick out the zeroth connected component of the graph defined in mention-graph.gv, ie. the largest one.
That was easy. The other two birds, making the rendering of the big graph faster and removing the dull stuff around the edge, we kill with one stone. We use ccomps to pick out the largest 1,001 connected components of the graph and plot only those:
ccomps -zX#0-1000 mention-graph.gv | \

grep "-" | cat <(echo "digraph mentions {") - <(echo "}") | \

sfdp -Gbgcolor=black -Ncolor=white -Ecolor=white \

  -Nwidth=0.02 -Nheight=0.02 -Nfixedsize=true \

  -Nlabel='' -Earrowsize=0.4 -Gsize=75 -Gratio=fill \

-Tpng > ccomp0-1000.large.pngYou'll notice that we snuck a little trick in there, which was flattening the output of ccomps using grep|cat<(echo). That little one-liner takes a single graph composed of many wholly connected subgraphs and flattens it to a single graph of many connected components. There's no structural change to the graph but a flat graph renders more quickly.
There are a couple other tricks you'll learn to use too:
- separate layout (sfdp) from rendering (neato -s -n2)
- use tee to save the output from stages in a pipeline
Something you'll want to play with as well (particularly for graphs larger than a few million edges) is removing certain nodes, particularly those with either a high degree (eg. remove accounts which are mentioned a lot) or a low degree (eg. remove accounts that are mentioned only once or twice). In the beginning I used SQL to do this min/max pruning but eventually got bored of waiting for SQL and wrote some Python instead.
This is pretty much the end of the @mention constellations series. I've had enormous fun generating these graphics, developing these techniques, learning and teaching along the way. It gives me huge satisfaction to see that @ialexs has picked up on this work and is taking it to the next level with such beautiful creations as this.


