The Bean is seven weeks old today.
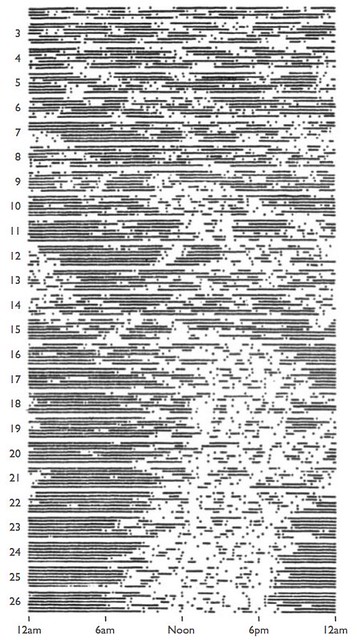
My good friend Jesse pointed me at the fantastic chart below showing what's in store with her sleep over the coming months.
Each horizontal scanline represents a day (the week numbers are down the left hand side) and the chart as a whole shows wakefulness and sleep for a single newborn subject over the course of the first six months of life. Sleep is depicted by a line; wake by gaps in the line. The dots are feedings. You can see a day/night pattern of wake/sleep forming, beginning around week 16 or so.
We've a while to go yet.


1 comment:
That graph is horrifying. D:
I've been told having children is a wonderful thing, though...
Post a Comment