So you checked out Part I and Part II, no doubt. You probably installed Graphviz, maybe you tried out the shell script I posted on pastebin, and perhaps you have your own one of these now:
If so, nice going. This post is going to dial it wayyy back and start at the beginning working with some basic Graphviz functionality.
Graphviz is a suite of software tools for working with graph data, where you can think of a graph as a set of nodes, some of which are connected by edges. At its most basic a graph is a bag of dots with a bunch of lines connecting some dots to other dots. As you'll see, there's more than one way of representing this visually
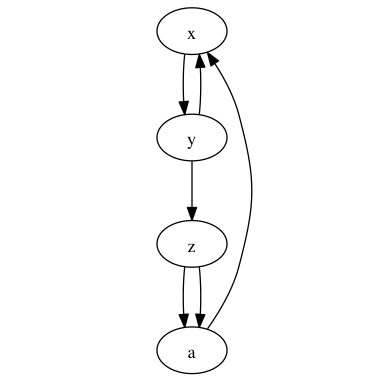
But talking of dots, Graphviz works with data assembled into a format known itself as DOT. Here's an example of a graph defined in the DOT language:
digraph basic {

    x -> y

    y -> x

    y -> z

    z -> a

    z -> a

    a -> x

}
Save the above graph definition as a text file called basic.gv (Graphviz documents have extension .gv by convention); we're going to use the basic Graphviz commands to visualize this graph in different ways.
At the command line, run this:
dot basic.gv -Tpng > basic-dot.pngSimple! This represents our graph perfectly. Try this:
neato basic.gv -Tpng > basic-neato.pngAnd then there's twopi and circo:

twopi basic.gv -Tpng > basic-twopi.pngand

circo basic.gv -Tpng > basic-circo.png
Finally, we're going to add some styling options to the graph. Run this command:
circo basic.gv -Gbgcolor=black -Ecolor=yellow -Earrowsize=0.3 -Epenwidth=0.4 -Nlabel='' -Nwidth=0 -Nheight=0 -Nfixedsize=true -Gsize=4 -Gratio=fill -Tpng > basic-circo-options.pngYou can see how this works. The -G options apply to the whole Graph. The -N options to the Nodes and the -E options to the Edges. There's online documentation covering all the various options.

Now imagine that rather than basic.gv
digraph basic {

    x -> y

    y -> x

    y -> z

    z -> a

    z -> a

    a -> x

}
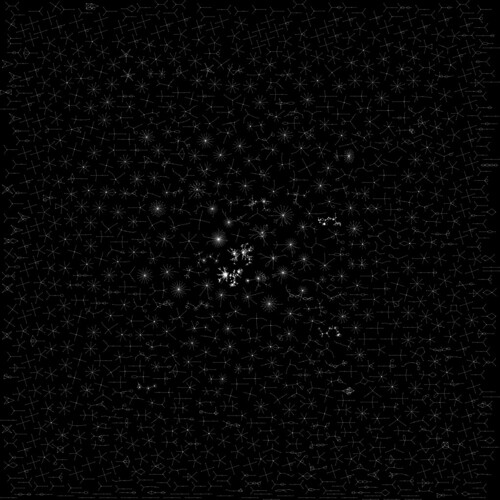
In the meantime, here's where you can ultimately take this. A 369 megapixel graph of the largest connected component amongst 30m mentions on Twitter, with the most active 80k users removed. I'm working on identifying the clumps; I suspect that they're geographic or language regions.
No comments:
Post a Comment