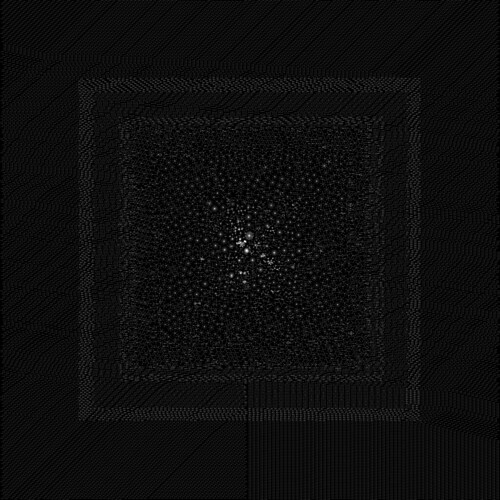
So far there's been
- DIY @mention constellations, Part I—wherein we set the scene
- DIY @mention constellations, Part II—wherein I post code which generates one of these
- DIY @mention constellations, Part III—wherein we learn how Graphviz does its stuff
Getting the data is easy enough: see the embedded 39-line Python script in the sample code. So let's say you run that Python code to give you 50,000 random mentions from the Twitter firehose. Let's say that having done that, having sort'd and uniq'd, and added a one-line header and one-line footer you have, like I do, a 47,375-line file which begins with
digraph mentions {

"0001am_" -> "kaaly_"

"000eca000" -> "000eca000"

"000eca000" -> "kira_moka"

"000parra" -> "amolosflips_"

"00_dag" -> "nishinoakihiro"

"00alliesmeaton" -> "caitlanpratt"

"00kuro" -> "sena1029"

"00nelht" -> "gvwriters"

"00rico00" -> "tsubo0307"
"zwackleby" -> "gauravh1"

"zxicee" -> "parnnnparnnn"

"zyhafiyah" -> "amyshaheera"

"zyhnlyh" -> "elsaaps"

"zymecca" -> "wowkonyol"

"zz0_ee" -> "becky_aisha"

"zzangfia" -> "somin_somu"

"zzz_ho" -> "dewwanna"

"zzzoob" -> "ko5712"

}
Having seen how simple Graphviz is, you'll probably render a graph directly from this file, with a command like
sfdp -Gbgcolor=black -Ncolor=white -Ecolor=white -Nwidth=0.02 \

    -Nheight=0.02 -Nfixedsize=true -Nlabel='' -Earrowsize=0.4 \

    -Gsize=75 -Gratio=fill -Tpng mentions.gv > mentions.png
Most likely you'd be agog, like I was when I ran this process for the first time. And then, like I did, you'd wonder how to make it faster and how to get rid of the fairly dull stuff round the edge. You might also wonder, like I did, what's inside that blob in the center.
That's for next time.

No comments:
Post a Comment